
Loading product…
Loading product…
Need Help?
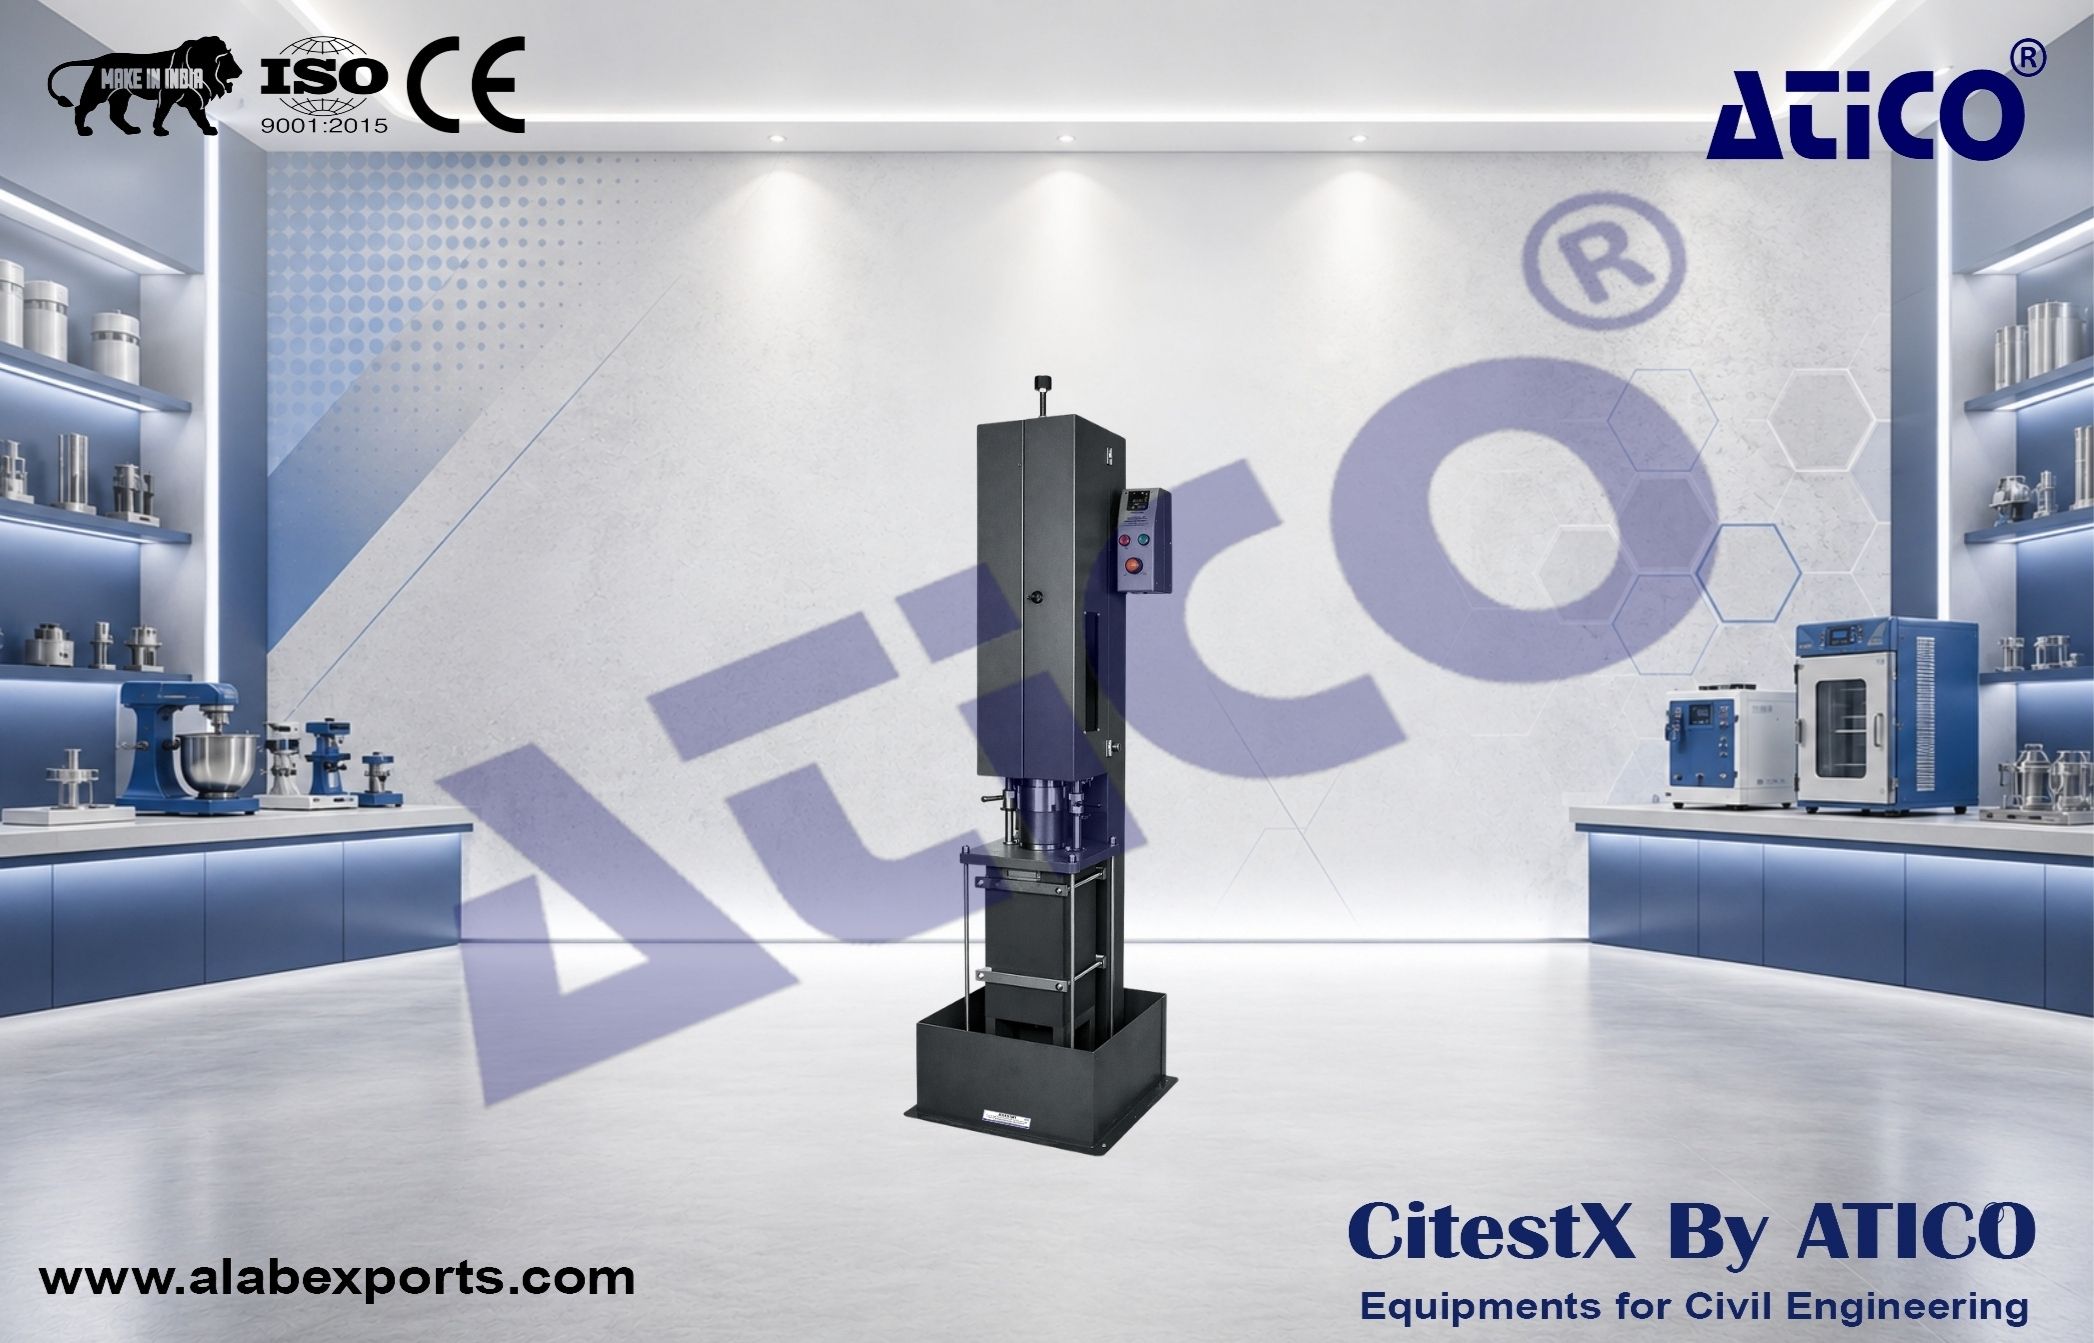
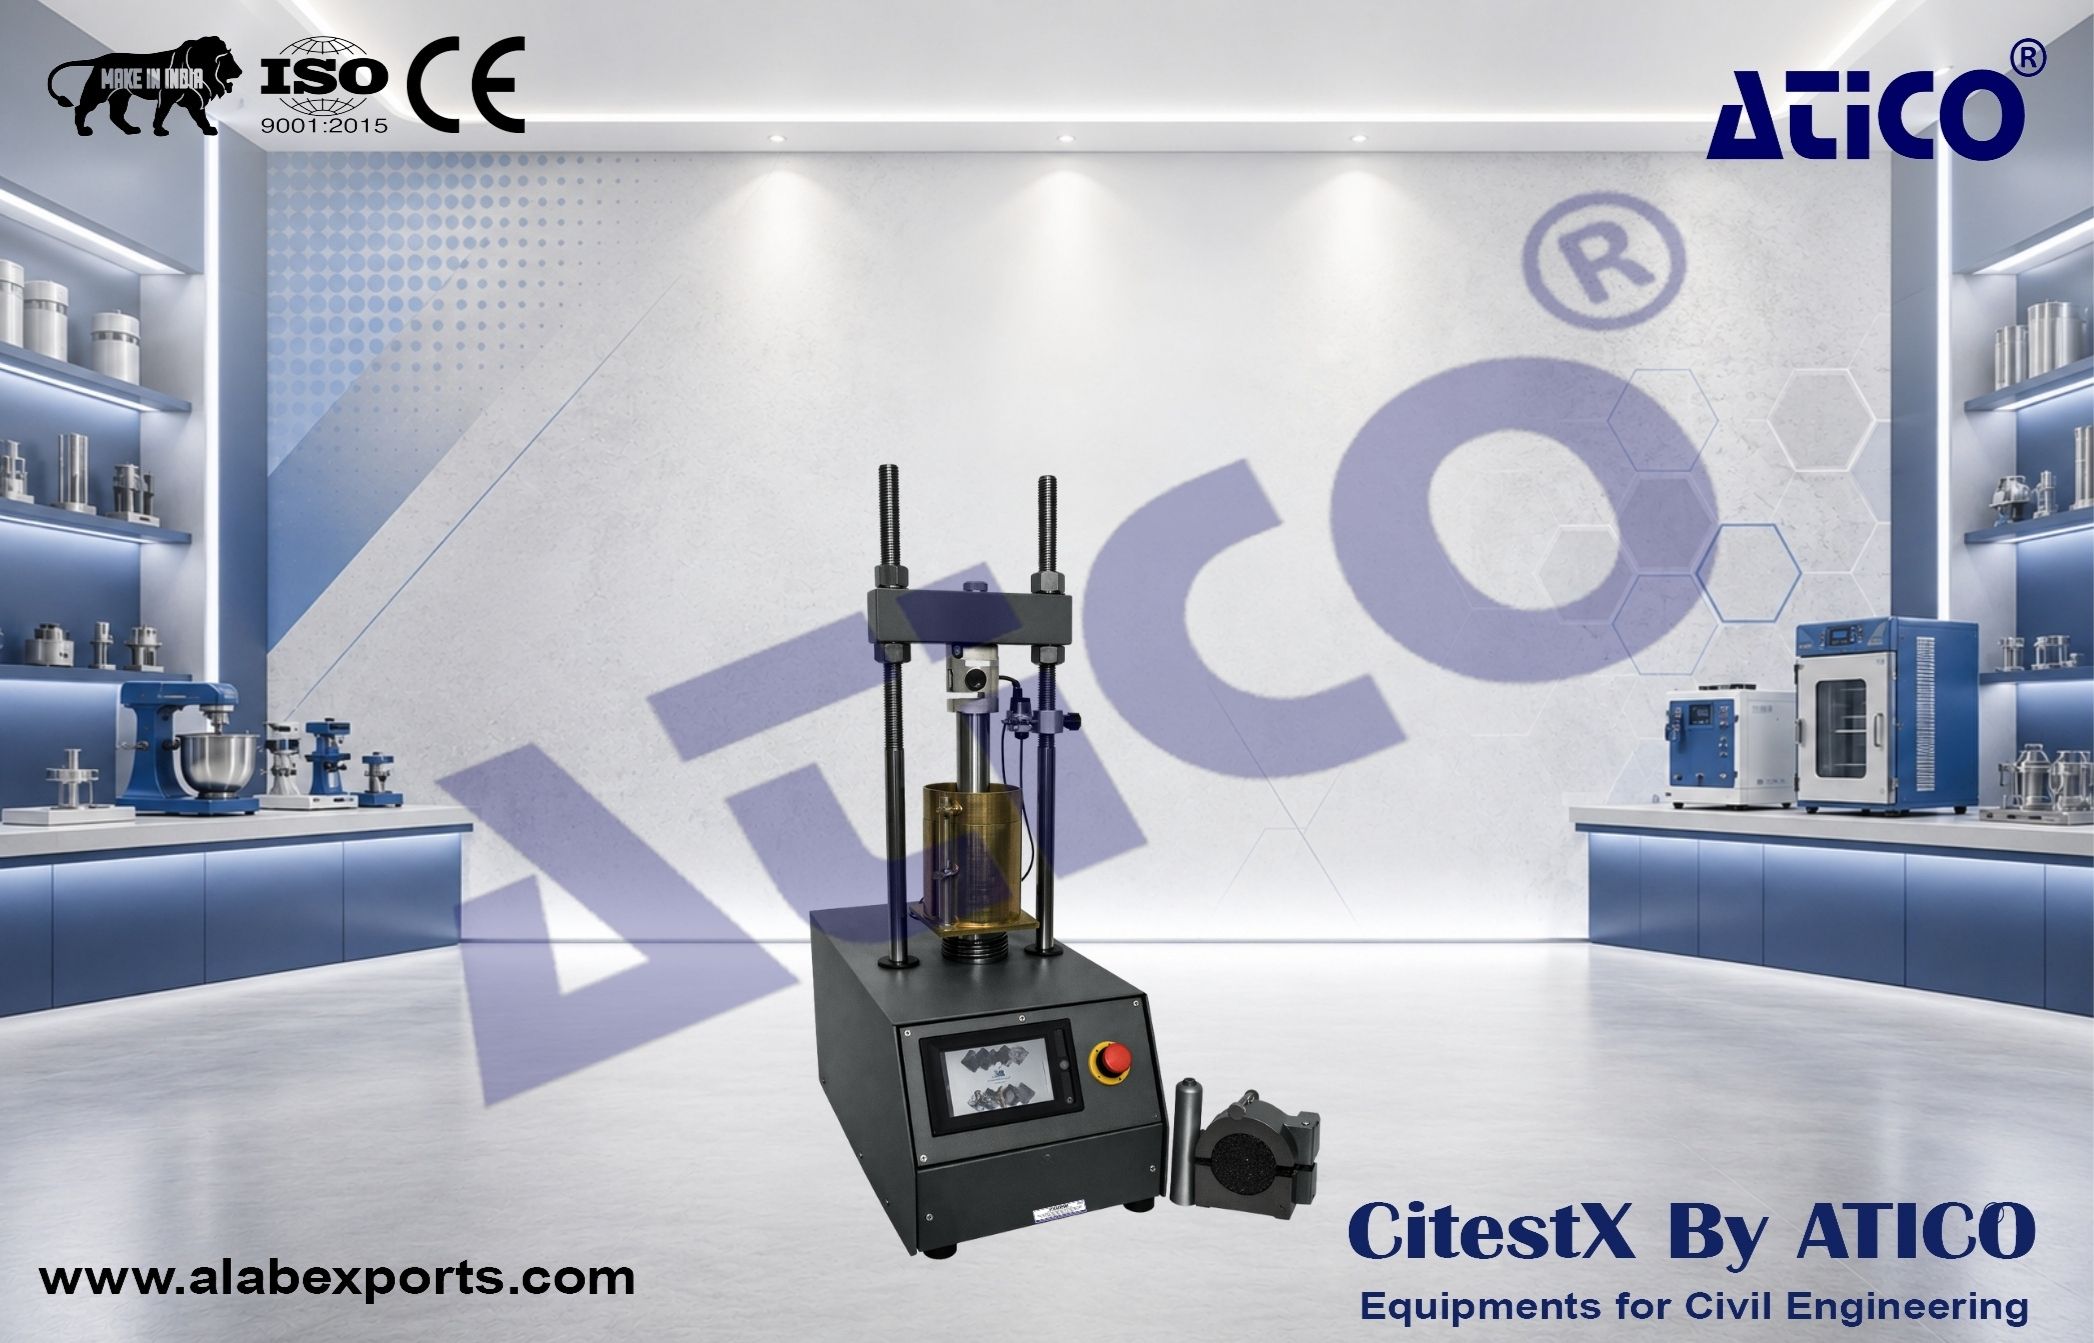
+91 98967 93832CBR & Marshall & Uniaxial Testing Machine is used to make CBR, Marshall and Uniaxial Unconfined Compressive Tests.
The device is composed of a robust and compact two column frame with adjustable upper cross beam driven by an electromechanical ram.
Models
Two models are available as 50 kN and 100 kN capacity.
CBR & Marshall & Uniaxial Control Unit
CBR & Marshall & Uniaxial Control Unit is designed to control of data from displacement transducers which are fitted to the machine.
All the operations of CBR & Marshall & Uniaxial Control Unit are controlled from the front panel color resistive of TFT-LCD touchscreen display and function keys.
The unit can perform CBR & Marshall & Uniaxial tests as a stand-alone without the use of a PC or with the H-GUI CBR & Marshall & Uniaxial Software and a PC. Control of machine, acquisition of load and displacement data in real time are provided by the unit.
The unit has easy to use menu options.
It displays all menu option listings simultaneously, allowing the operator to access the required option in a seamless manner to activate the option or enter a numeric value to set the test parameters and see all the data while the test running.
Main Features of CBR & Marshall & Uniaxial Control Unit
Features
Hardware Features
Software
CBR & Marshall & Uniaxial Software has been designed for CBR & Marshall & Uniaxial Tests.
The software includes control of machine, acquisition of load and displacement data, generating and saving reports.
For CBR Tests
The software prepares a summary result for the user that will only need some specific loads such as at 0.625, 1.25, 1.875, 2.5, 3.125, 3.75, 4.375, 5, 7.5, 10 and 13 mm.
The software continuously updates load, stress and displacement till the end of test. Software can automatically draw the best tangent line and perform the upward concave correction as suggested by ASTM D1883. The corrected stresses values are then calculated with respect to this offset.
The CBR value at 2.5 mm and 5.0 mm are calculated by using the standard load values at those penetrations.
For Marshall Tests
Test type is selected in the software and then the sample height is entered as the test parameter. It automatically calculates correction factor coming from the standards with respect to specimen thickness. The stability value is calculated regarding this factor.
The software continuously updates load and displacement until the end of test. When the test is completed, the sharpest slope of the graph is calculated. The sharpest slope is shifted 1.5 mm to the right side of the graph and the intersection between 2nd slope and original test data is recorded as the stability value for the test. The horizontal distance between the intersection of first slope and X axis and intersection of test data with 2nd slope is recorded as flow value.
The report includes all results for 4 samples. The user can see 4 of the results on the same screen for easy comparison.
Test Speed :
Dimensions (cm) :
Weight (kg) :
Power Supply :
Spare Parts & Accessories :