
Loading product…
Loading product…
Need Help?
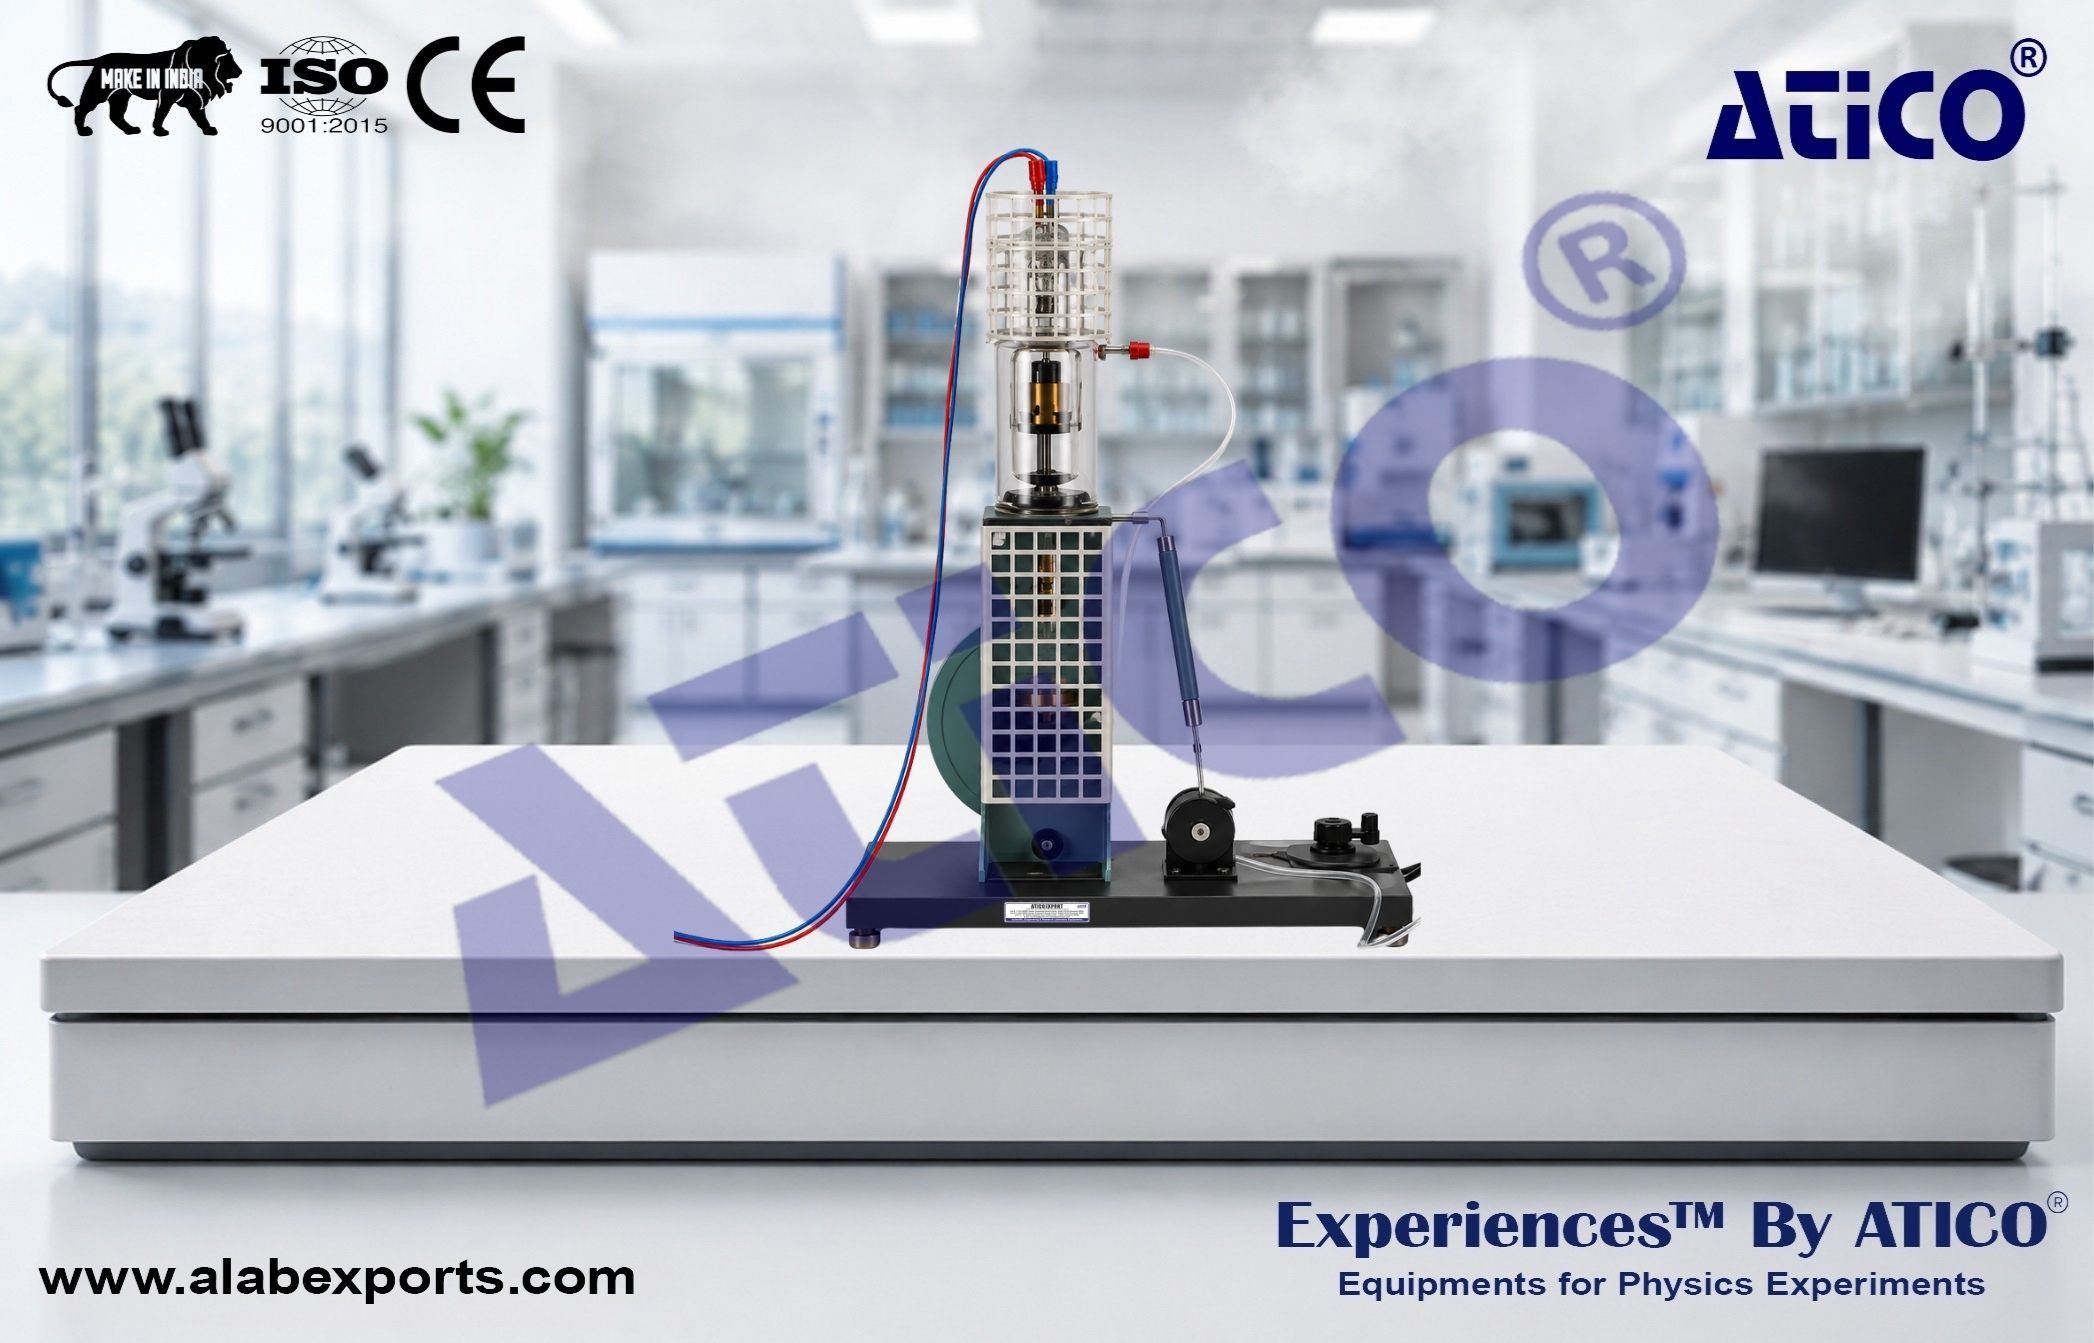
+91 98967 93832The Hot-Air Engine pV Diagram Experiment is designed to record and analyze the pressure-volume (pV) diagram of a hot-air engine operating as a heat engine. Using software-based data acquisition, the apparatus simultaneously measures the cylinder pressure and piston position to generate a real-time pV diagram. The recorded data enables students to calculate the mechanical work performed per cycle, determine the engine power, and analyze engine performance under different operating conditions. Manufactured by Atico Export India.
Principle
The experiment is based on measuring the pressure inside the engine cylinder and the corresponding piston displacement during engine operation. The pressure sensor continuously records the cylinder pressure, while the rotary motion sensor measures the piston position, from which the cylinder volume is calculated. Software displays the pressure-volume (pV) diagram in real time. The enclosed area of the pV diagram represents the mechanical work performed during one operating cycle, which is further used to determine the engine power and study its variation with engine speed.
Objectives
System Components
Hot-Air Engine :
U-Core with Yoke :
Clamping Device with Spring Clip :
Mains Coil :
Low Voltage Coil :
Data Acquisition Interface :
Data Analysis Software :
Rotary Motion Sensor :
Pressure Sensor :
Fishing Line :
Helical Spring :
Connecting Leads :
Immersion Pump :
Low Voltage Power Supply :
Silicone Tubing :
Wide-Mouthed Can :
Virtual Experiment Software :
Additional Requirement
Computer :
Software-Based Data Acquisition :
Real-Time pV Diagram :
Pressure Measurement :
Rotary Motion Measurement :
Automatic Data Analysis :
Educational Design :